What influences people’s choice of mode of travel?
Travel costs influence people’s transport behaviours. But the relationship between these costs and behaviours is not simple. Many journeys are taken for a specific purpose, such as travelling to work, to school, to the doctor’s or to a local grocery store. People have to take these journeys even if the cost increases. However, where somebody has several options of how they can undertake these journeys, cost can be an effective lever for encouraging behaviour change. When journeys are taken for leisure purposes, there is even more scope for behaviour change. Global research from BCG has found that consumers are more likely to be price sensitive when purchasing leisure travel, when compared to nine other consumer goods categories. 1 Journeys taken for leisure purposes accounted for 36 per cent of trips in London in Q1 of 2022/23. 2
The cost of sustainable transport can be a barrier preventing positive behaviour change. In a recent ONS survey, 39 per cent of people reported that greener forms of transport were “too expensive”. 3 This survey result also shows that people’s perception of cost influences their decisions. Whilst EVs are expensive, walking and cycling are the cheapest modes of transport.
Cost also intersects with other factors – even people who are motivated to reduce their spending will not always choose the lowest cost option. The list below sets out some of the factors involved in the choices people make:
- The travel environment: the physical infrastructure available and the convenience of this for the journey a person wants to take.
- Personal capabilities and needs: such as if you need to transport your family or just yourself, if you need to combine multiple activities into one journey or if you have additional travel needs as a result of having a disability.
- Attitude: transport choices can also be driven by personal values and attitudes. This may take the form of identifying with a given transport mode, such as considering yourself a “car person” or a “cyclist”. Attitudes are also often impacted by social norms and the behaviours of people around you.
- Habit: people may choose to use a given mode of transport because it is the mode they have always used for that journey and so they do not actively consider alternatives when embarking on the trip.
- Affordability: the perceived or real cost of a given transport mode relative to a person’s disposable income.
The strength of these motivational factors will vary for everybody. But some groups are more likely to drive than others. Our accompanying report Supporting Sustainable Travel in Outer London explores the differences in travel behaviour between groups. Households in outer London are more likely to own or have access to a car than those in inner London, and driving is used for travel twice as much in outer London as in inner London. The report explores some of the reasons for greater private car use in outer London including lower density development in outer London, poor access to the public transport network, and limited infrastructure for active travel.
Gender, ethnicity, age and income all influence travel behaviours. Here are some examples of how:
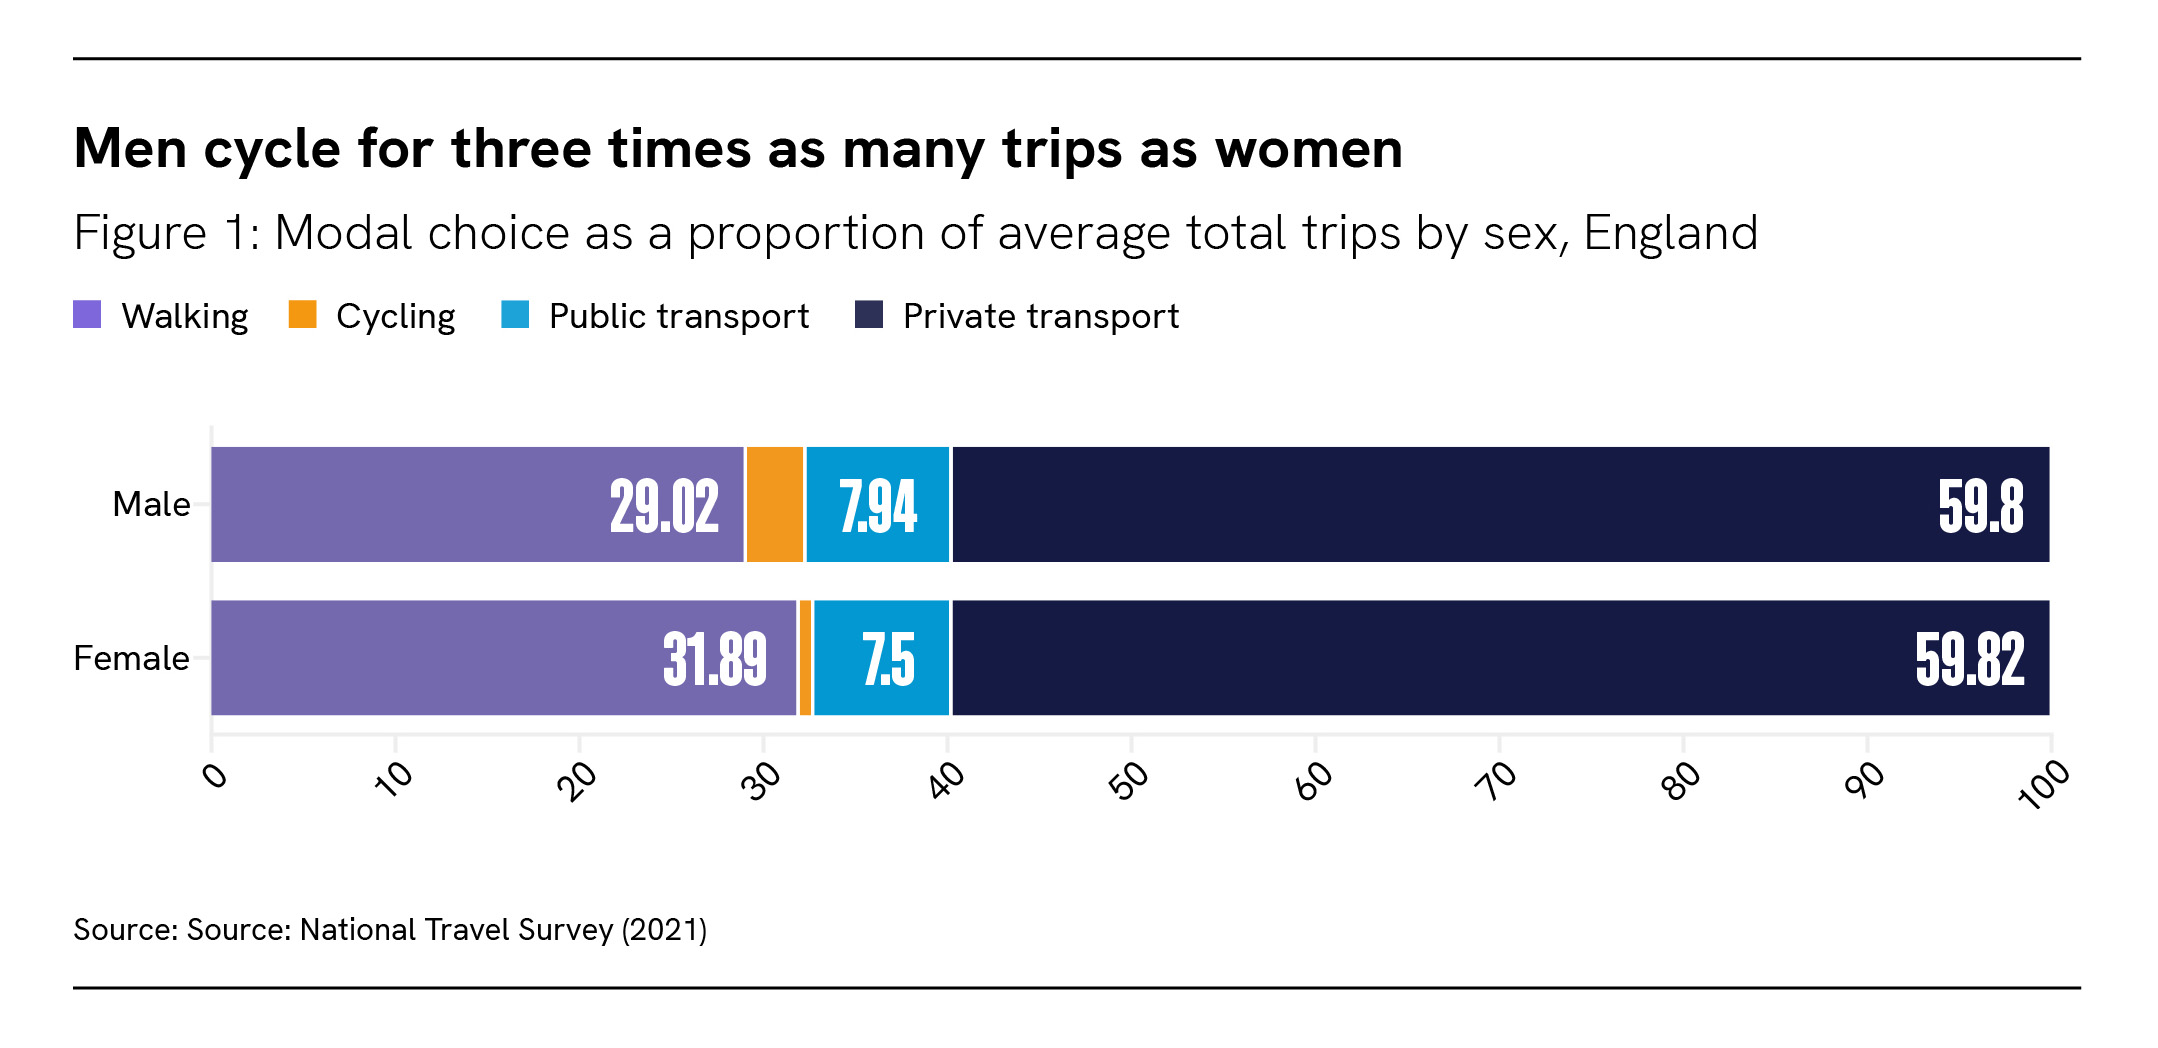
- Women walk for a greater proportion of trips than men, whilst men cycle for more than three times as many trips as women (see Figure 1). The gendered nature of domestic and caring responsibilities often means that women make more frequent and shorter trips. 4 These sorts of short journeys lend themselves to walking, but the additional needs involved in caring whilst on a trip can make cycling an unsuitable transport mode. Research from Sustrans also found that women often do not feel safe when cycling. 5
- Black, Asian and minority ethnic Londoners are more likely to use the bus than White Londoners 6 and less likely to cycle. 2 The latest Travel in London report found that whilst the proportion of Black Londoners cycling at least once a week has not increased, weekly cycling by Asian Londoners has grown since the pandemic.
- People over the age of 55 in London are least likely to cycle. 8 A 2021 TfL survey found that just 12 per cent of Londoners aged over 55 reported having cycled in the last year compared to 36 per cent of 16-34-year-olds. A report from Age UK argues that rates of cycling in over-65s in the UK are low compared to other European countries and implies this is due to poorer cycling infrastructure rather than less physical capability. 9
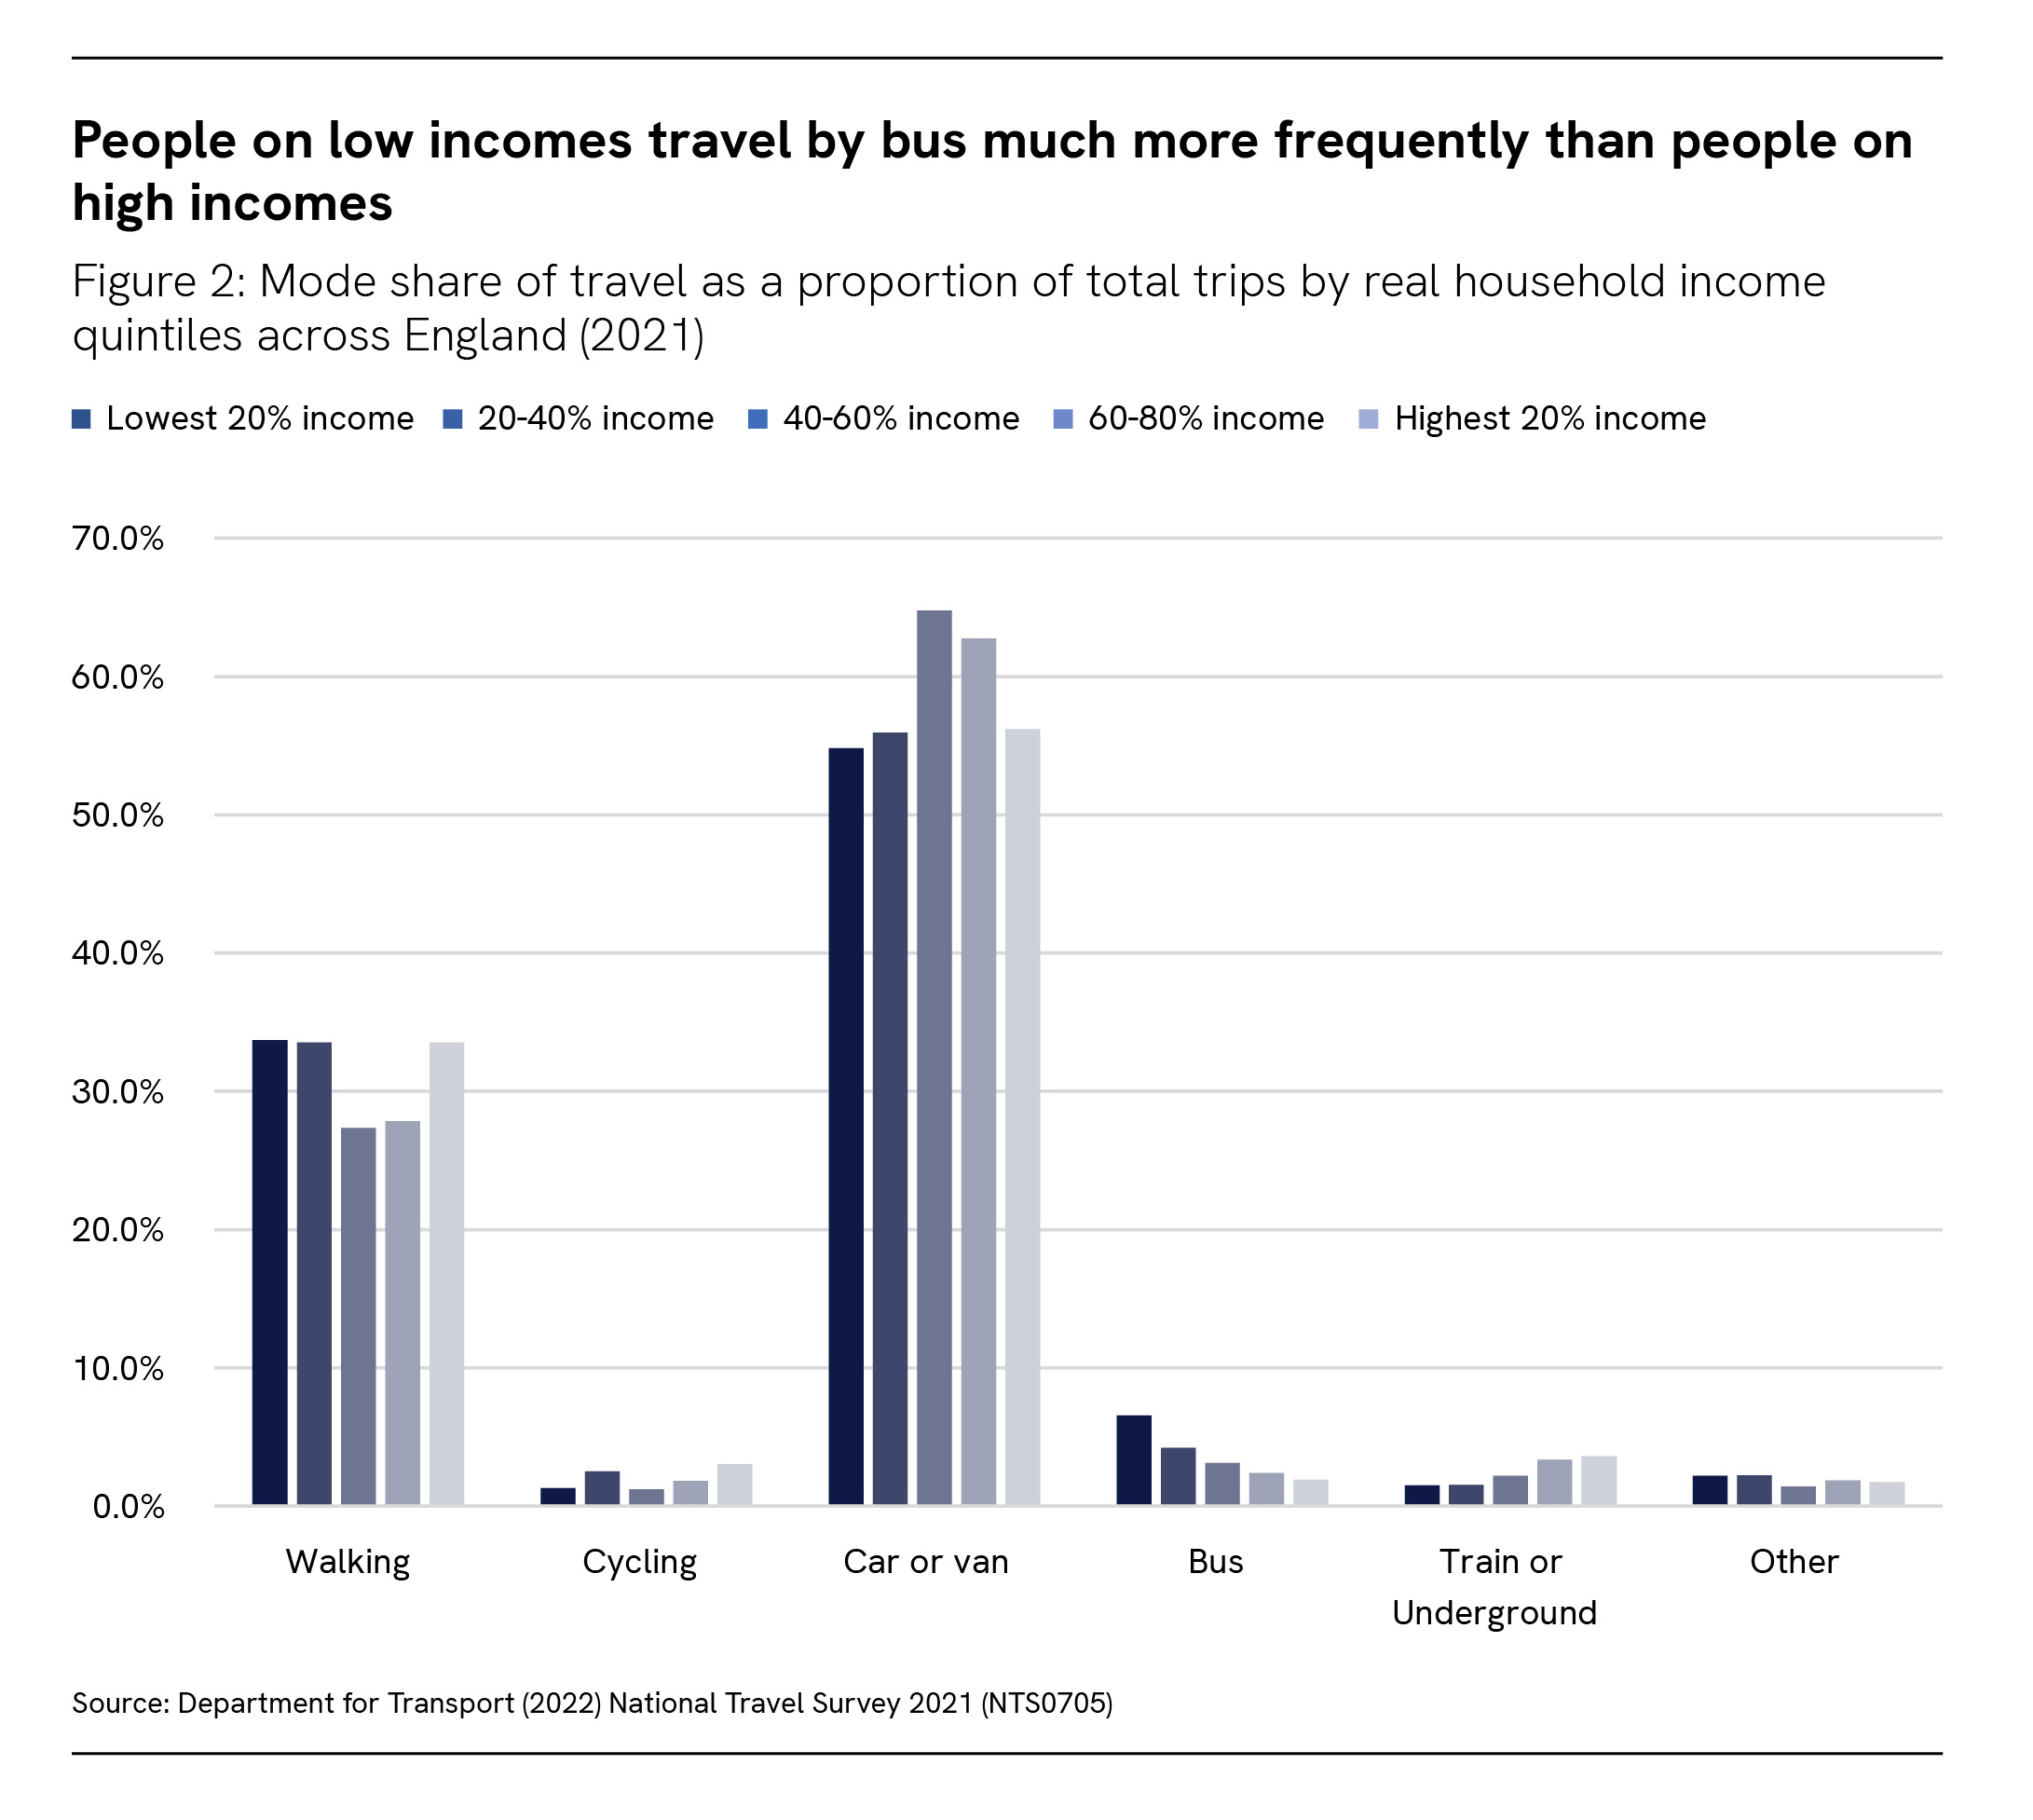
- People in lower-income households travel by bus far more than households on higher incomes; meanwhile, the inverse is true of train travel (see Figure 2). One explanation for this pattern is the relative cost of these transport modes; bus fares are typically much cheaper than train fares.
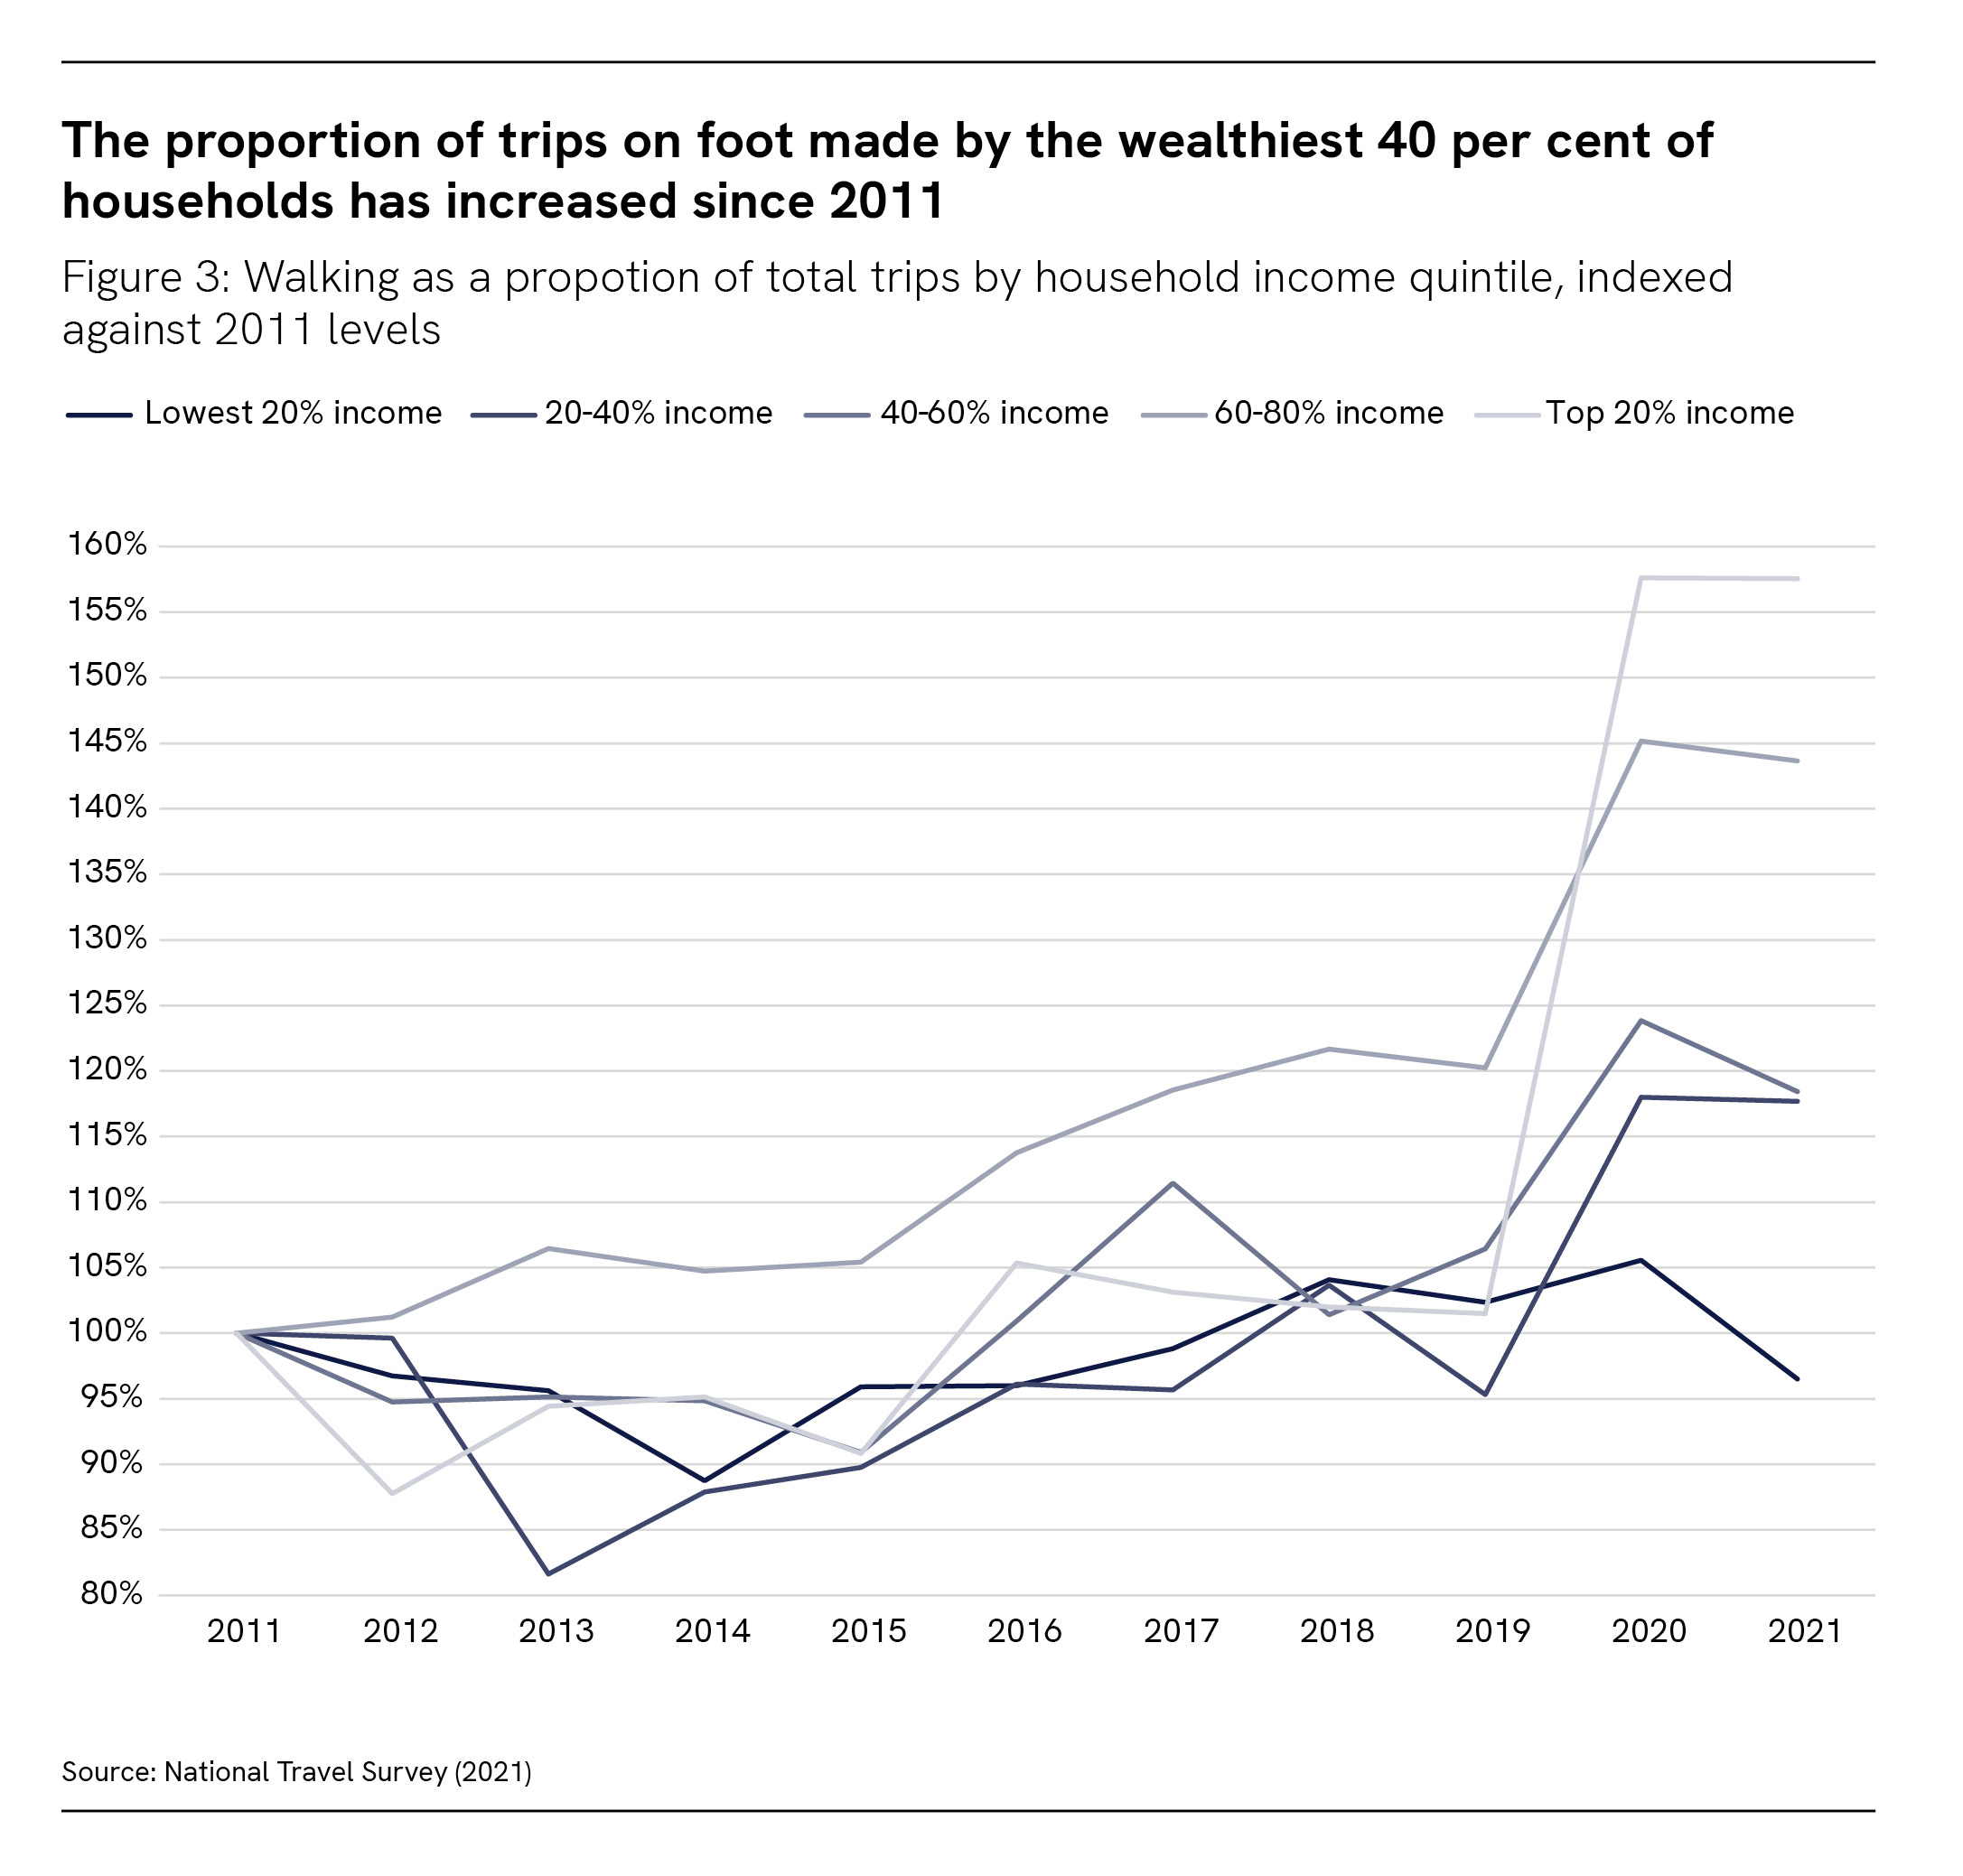
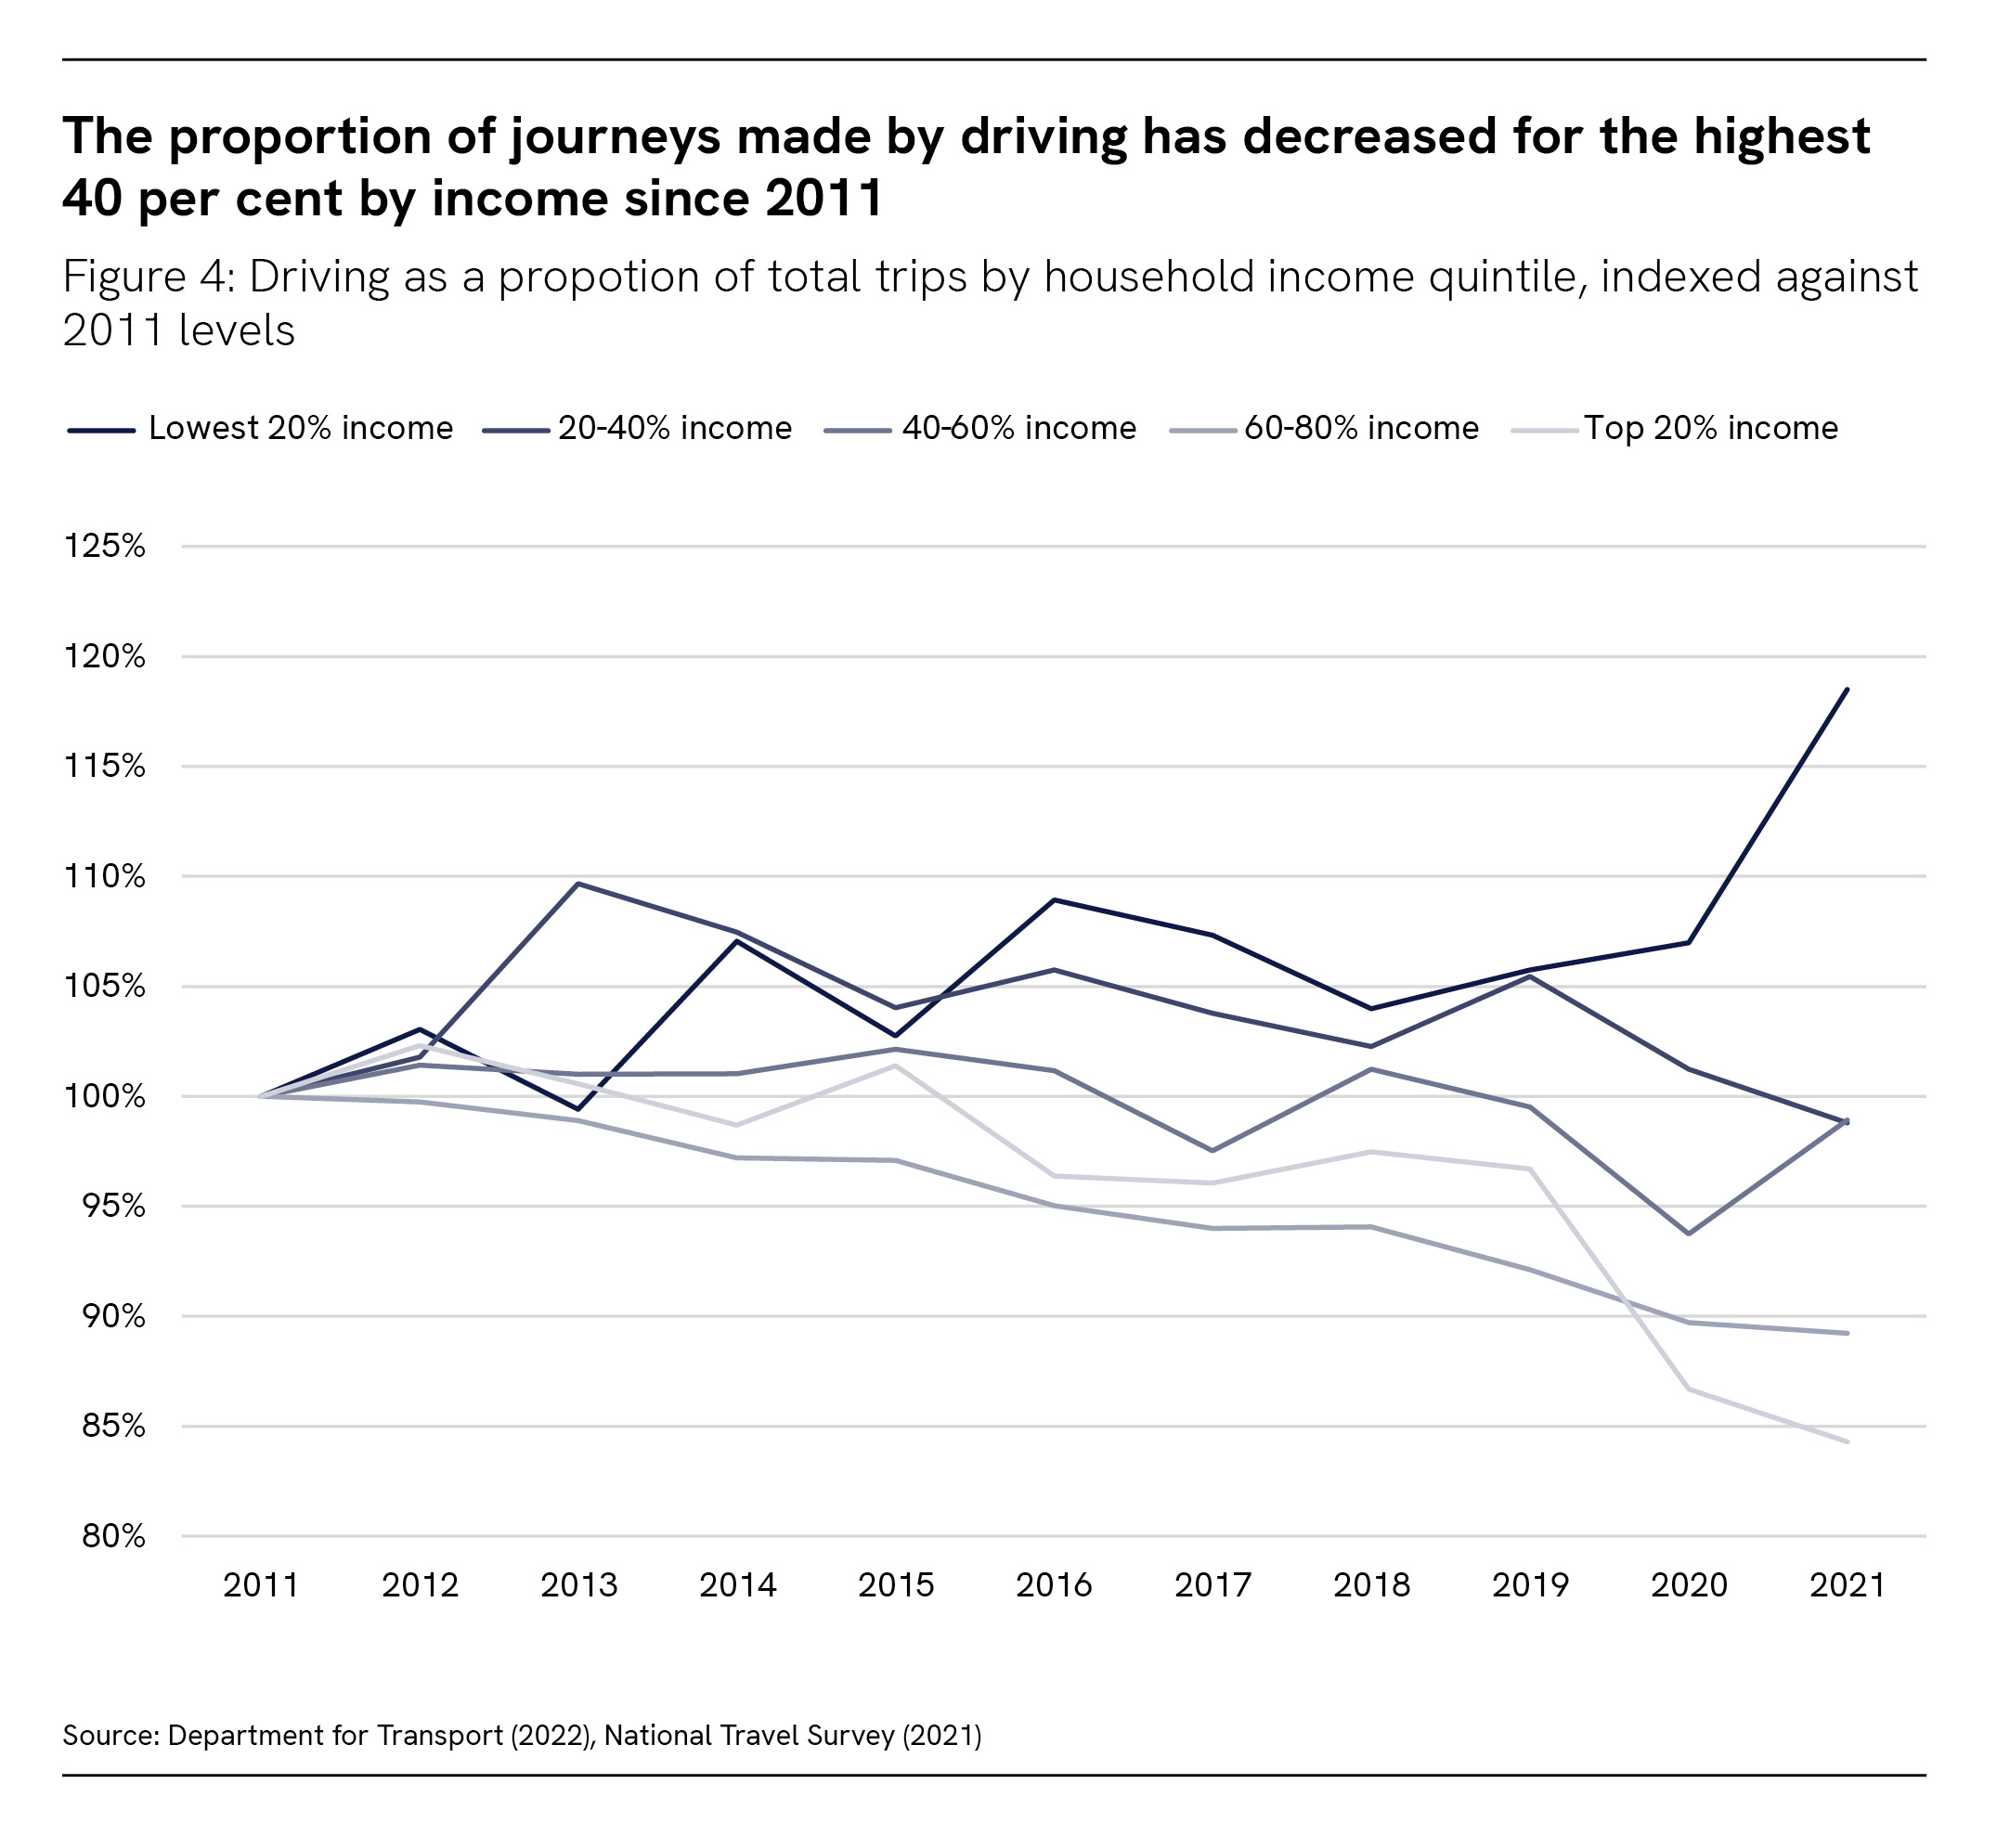
- Between 2011 and 2021, the proportions of trips on foot made by the wealthiest 40 per cent of households has substantially increased while the proportion for the lowest 20 per cent has remained roughly the same (see Figure 3). Similarly, the proportion of trips made by car or van has been steadily decreasing for wealthier groups whilst staying the same or increasing for lower-income households (see Figure 4). Households with the lowest incomes are also likely to drive less than wealthier households but drive shorter distances when they do. 10